2026 MLB ABS challenge system tracker: Team, player rankings
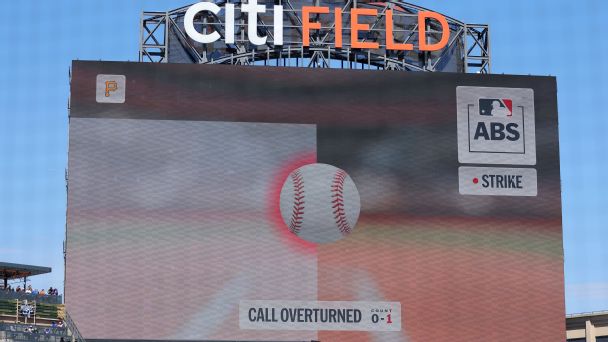
The automated ball-strike challenge system has quietly become one of the more fascinating subplots of the 2026 MLB season, and the emergence of organized leaderboards tracking team and player performance within that system is worth paying attention to well beyond the novelty factor. What started as a rules experiment has matured into a genuine layer of in-game strategy, and now that the data is being aggregated and ranked, it becomes something bettors can actually use rather than just appreciate from a distance.
The core mechanic is straightforward: players and managers have a limited number of challenges to dispute ball-strike calls, and the system tracks how accurately those challenges are deployed. When you start ranking batters, catchers, teams, and even umpires by their challenge success rates, you are essentially building a map of who is gaining free bases, who is costing their team outs, and which umpires are getting squeezed the hardest. That last point matters enormously — certain umpires with historically tight zones or expanded zones already move totals at sportsbooks, and an ABS challenge leaderboard that surfaces which umps are getting overturned most frequently gives sharp bettors a more precise tool for the same job.
From a line-movement perspective, the mechanism here works on a few levels. Totals are the most direct application. An umpire who gets challenged and overturned frequently is, by definition, calling a zone that deviates from the true strike zone — which has downstream effects on how deep starting pitchers work, how many batters reach base on what should have been strikeouts, and ultimately how many runs score. Bettors who can identify high-overturn umpires assigned to a given night's slate before the market fully adjusts have a repeatable edge. On the team and player side, a lineup stacked with disciplined challengers who convert at a high rate is effectively drawing more favorable counts than their raw walk and strikeout numbers would suggest. That kind of information can sharpen first-five-inning run line bets and player prop projections for on-base focused markets.
The follow-on questions worth tracking are these: Do high-challenge-conversion teams show a statistically meaningful bump in run production compared to lower-ranked teams on an equal talent basis? Are specific catchers who excel at framing and challenge strategy correlating with better pitcher performance and lower opponent run totals? And perhaps most importantly, as the season progresses, how quickly are sportsbooks incorporating ABS leaderboard data into their umpire-based line adjustments? The bettors who map that gap between publicly available ABS data and market reaction time will be the ones extracting the most value from what is, on the surface, just a tech update to America's pastime.
Reporting via ESPN. Analysis by the 4th & Value desk.
 2026 MLB trade deadline prospect watch for all 30 teams
 Abrams leads Nationals against the Diamondbacks after 4-hit outing
 Mets take home losing streak into matchup with the Dodgers