Fantasy Baseball Reliever Depth Chart
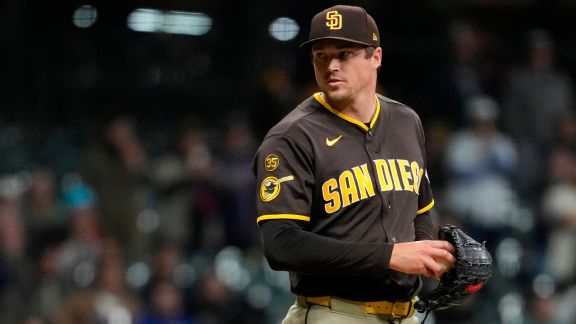
The bullpen landscape in Major League Baseball shifts faster than almost any other variable in the sport, and anyone with money on the board ignores reliever depth charts at their own peril. Updated closer hierarchies and bullpen fatigue tracking aren't just fantasy baseball housekeeping — they're a real-time window into one of the most volatile and wagerable corners of the game. When the data behind who's pitching, how often, and in what leverage situations gets refreshed, it carries implications that extend well beyond the fantasy wire.
Fatigue is the keyword here. Bullpens run hot and cold in ways that starting rotations simply don't, and teams that have leaned heavily on their best arms over a recent stretch are statistically more vulnerable in subsequent games. A closer operating on three appearances in four days, or a setup man who has logged back-to-back high-stress outings, represents a meaningful downgrade to a team's late-inning reliability. That erosion of bullpen strength doesn't always get baked into the lines immediately, particularly in early-week markets where sharp adjustments haven't fully settled.
From a betting mechanics standpoint, this kind of depth chart information most directly influences run line and game total decisions. A team with a fresh, dominant closer is a much stronger candidate to hold a one-run lead than a team whose ninth-inning option is either fatigued or unclear. Sportsbooks price totals and run lines partly on projected bullpen performance, but the models they use don't always capture real-time fatigue as quickly as a bettor who is actively monitoring usage patterns. The live betting market is especially susceptible here — if a tired reliever enters a close game in the seventh or eighth inning, in-game totals and the run line can lag behind the true probability of a lead evaporating. That's a gap worth exploiting when you've done the homework.
Closer hierarchy changes matter for a different reason: save opportunities drive individual player props, but they also reflect how a manager views the game situation. A team that has shuffled its closer role signals instability in the back end of their bullpen, which is a soft underbelly when facing lineups that are disciplined enough to work counts and extend at-bats late.
The questions worth tracking from here are straightforward but critical. Which bullpens are showing the highest recent workload, and are those teams scheduled in game environments — tight divisional matchups, low-scoring pitching duels — where the late innings will matter most? Are there any closer situations currently in flux that haven't been fully reflected in save prop pricing? And as rosters churn around the trade deadline or injury reports, which teams are quietly developing a second-tier arm who could become the primary option before the market notices? Stay close to the depth chart updates. The edges are in the details.
Reporting via ESPN. Analysis by the 4th & Value desk.
 2026 MLB trade deadline prospect watch for all 30 teams
 Abrams leads Nationals against the Diamondbacks after 4-hit outing
 Mets take home losing streak into matchup with the Dodgers